Forum Discussion

fred_temento's avatar
fred_temento
Occasional Contributor
8 years ago
Solved

Do not see fake memory leak in a DLL

Hello,


I am new to AQtime.


In order to understand how AQtime show memory leak (that i can understand) I decide to create a fake memory leak in a DLL of my exe : just a malloc(10) without free in a ctor of a call being instanciated ton of time.


When I quit my application... a ton of memory leak appears (not my code!) but not mine !


Furthermore, I did not find tuto or sample for pure C++ (not managed) memory profiling.

So I peak information on some tuto talking about delphi or C++ .net...


I did try with AQtime standalone and integrated in Visual Studio 2013.


can you help on why my fake memory leak is not find ?


  • Hi Alex,


    Thanks for all your comments.


    I did follow the recommandation for building native  c++ projects : I had to change my 52 projects of my application since an option was disabled and AQtime needs it (Function Level Linking). This was a great think since it generates a lot of link errors that were real errors (indeed I don't undestand how the code was working before !). I must say that my application was last converted from VC6 to VS2013 ! So the project file settings were automatically translated from VC6 to VS2013 (+ some manual action)... and those both compilers are REALLY different ! So switch FLL ON was a good thing !

    I also set all my project to use /Zi (since all my project can not use /ZI because of /SEshc settings)

    I verified and setup the directory to use PDB files (indeed it was good, only vc120.pdb was missing)

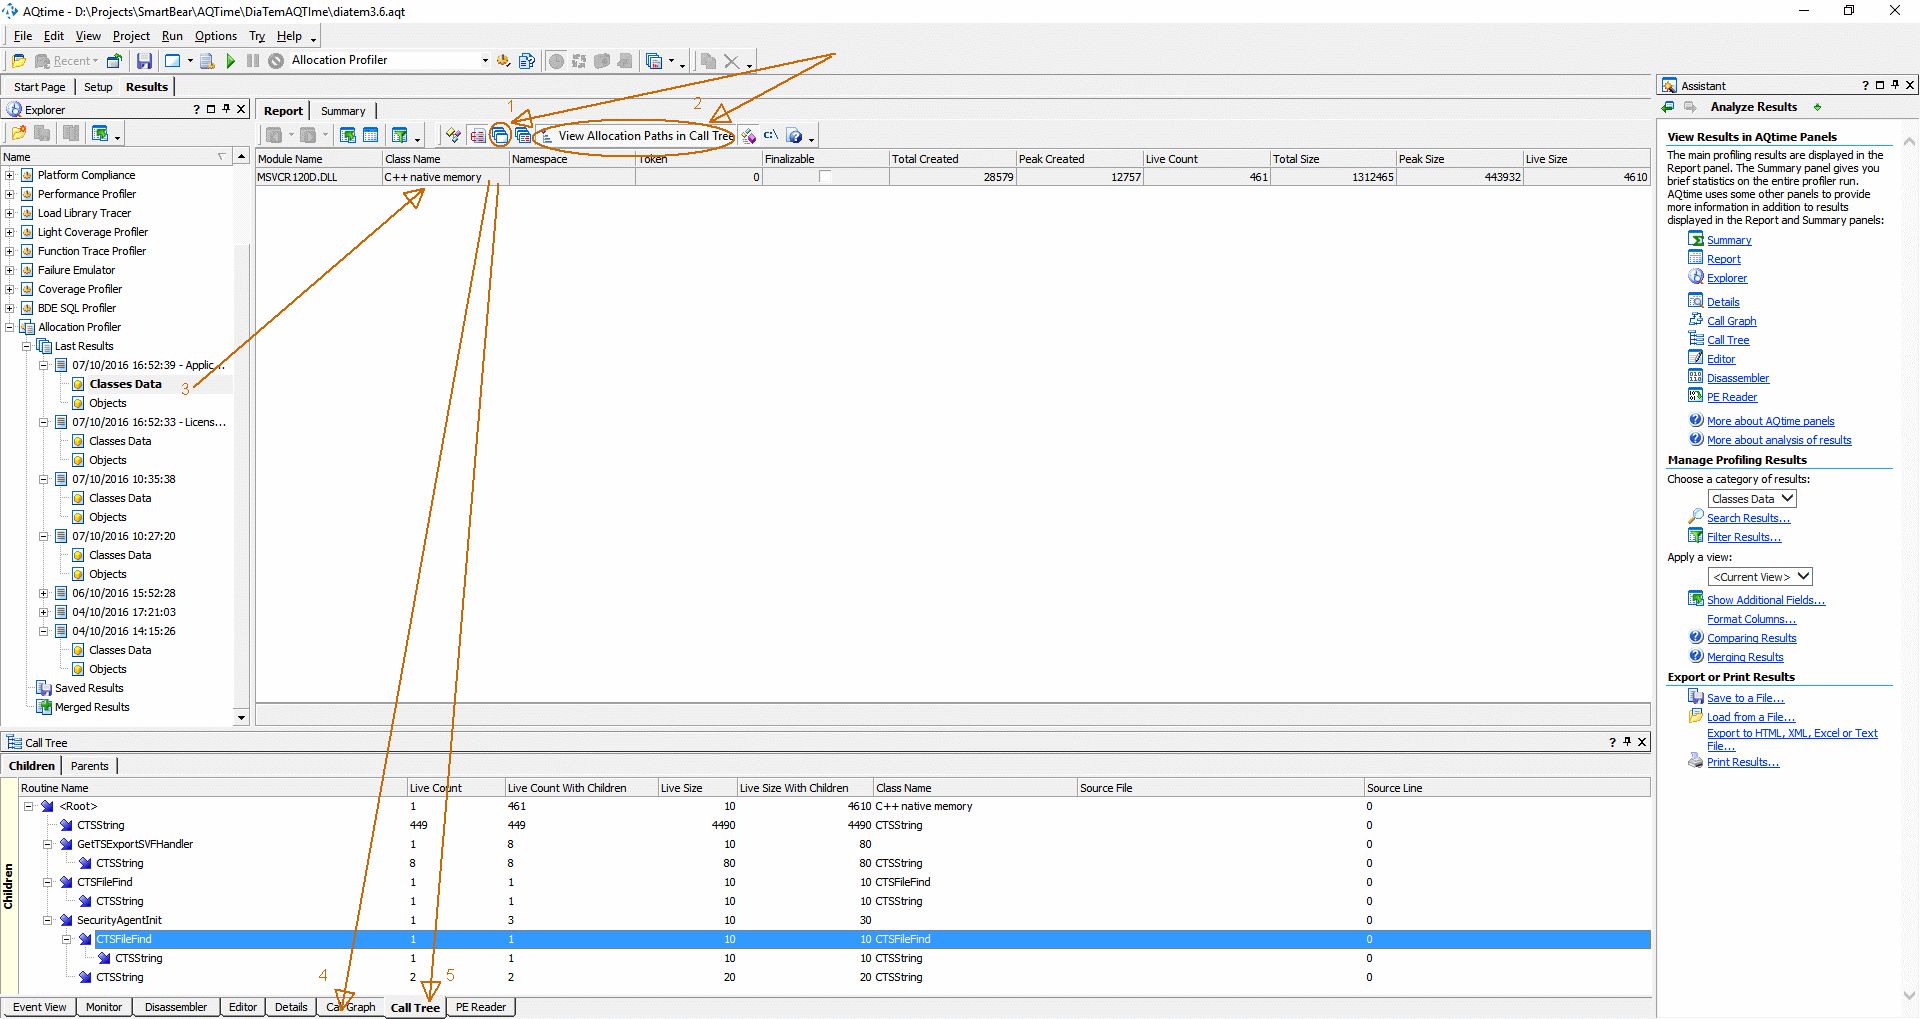
    I studied your screen shot (that was helpfull regarding the small button !) 

    I verified the "Project Search Drectories" for source picking.

    and I can see the same results as yours.


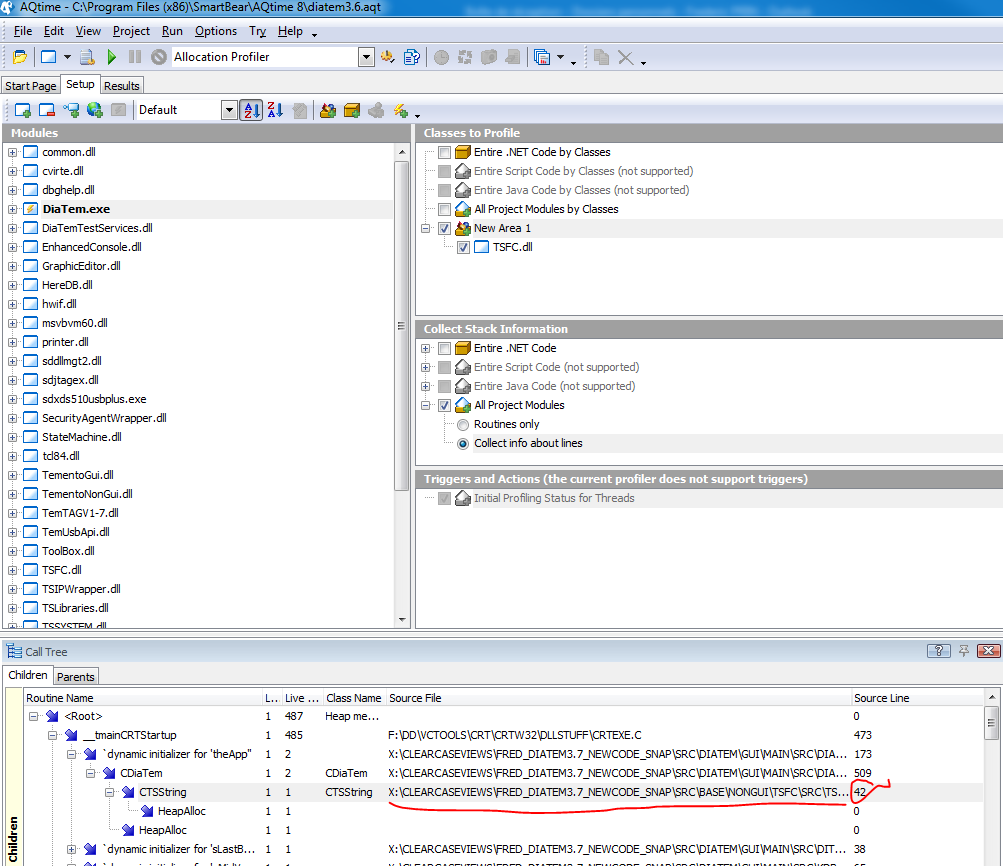
    I don't understand why it is mandatory to create a "class level area" since, by definition, we don't know where are memory leaks ! but I created it and put the DLL into which I create a memory leak (malloc without free).


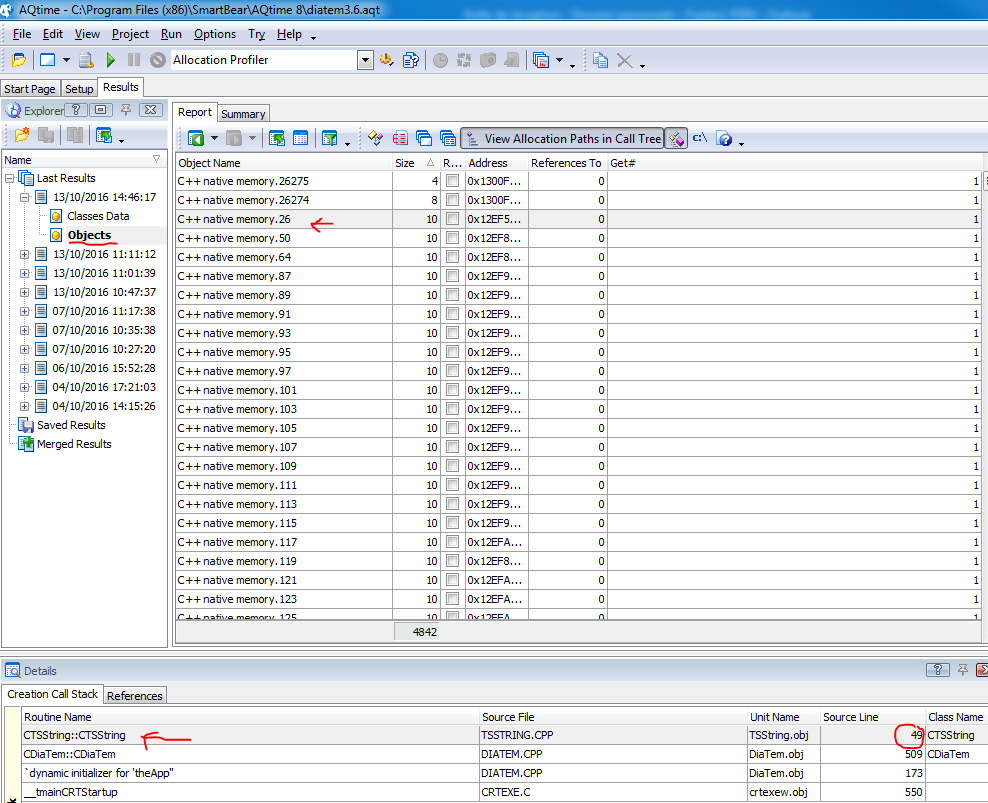
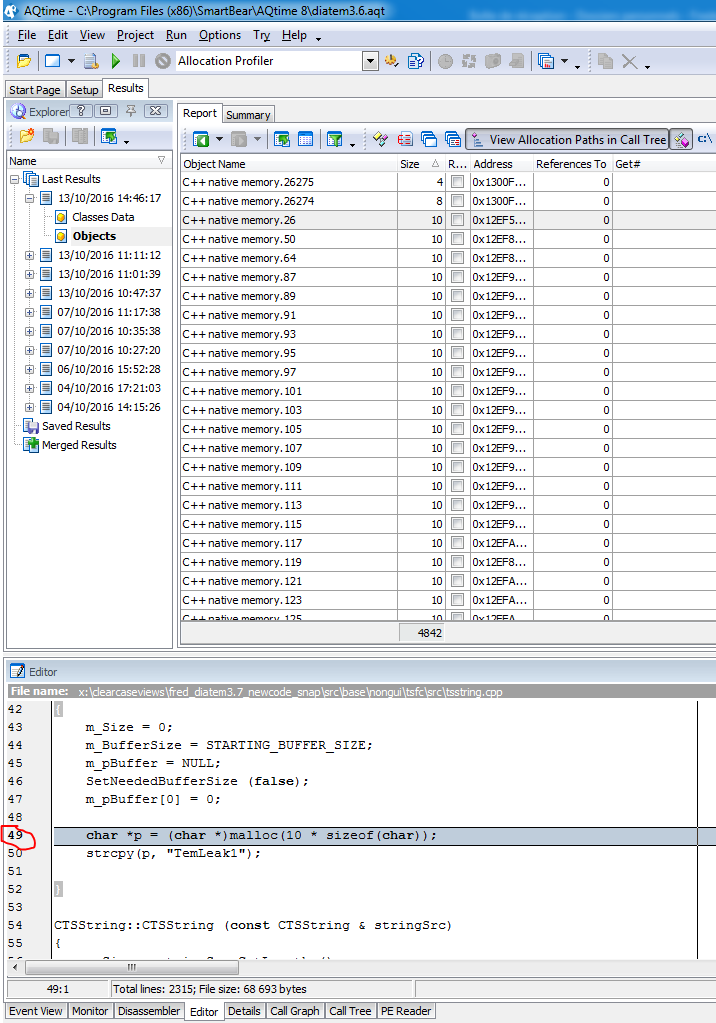
    Finally I can see the same results as yours + source file and line number ! (see attached)

    BUT still no source code can be viewed when double click on a Call tree CTSString line item....

    (no more error message saying that there are no source code available or no debug info)


    So, I must really thank you all the time you spent for me. I think there is something abnormal in my application solution that do not please AQTime. 


    I will know try with a dummy "hello world" like native C++ MFC application build from scratch using the VS2013 wizard and see if the results a re more accurate.


    and finally open a support ticket !


    Once again, many thanks to you ! 


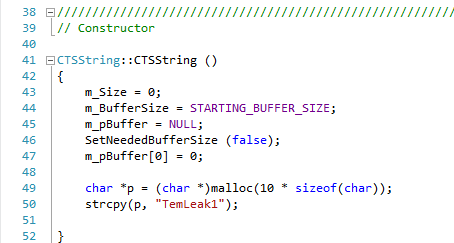
    oops : last minute ! I just saw that the line number of leak is really innacurate since it do not point on the malloc but on the ctor opening brace... at line 42 (see attached)


    very last minute !


    Finally after trying on another mushc smaller app, reading more help, clicking everywhere..; I finally found what I am looking for days : 


    The "Classes Data" view is not the better place to find leaking code but just if there are leak

    The "Objects" view is better ! Associated with the Details view, Creation Call Stack pane, allow to double-click on a symbol and see the source code ...

    BUT this must be used with the "View project class only" button DISABLED ! (so thanks for that !). So now I find my dummy leak (see attached).


    My point of view is that having memory leak information is not a straight forward process !

    To much information makes real information noisy. (I was thinking that purrify was too verbose... but AQTime is much more graphically noisy!).

    Also the "Object Name" column that list "C++ native memory.xxxx" is not really helpful.


    I think that a simplified unique view can be done in order to directly point on the memory leak.


    Now I can refine my question:

    - What is the aim of the magic button "View project class only" ?? 

    It seems strange to disable it in order to see the leak of the class of my project! Is project meaning only the executable ??

    why my DLL behing part of my project is not considered as included in my project ??


    Anyway, I set this post as Answered. 


    Thanks again Alex.


9 Replies

  • AlexKaras's avatar
    AlexKaras
    Champion Level 3

    Hi,


    > fake memory leak in a DLL of my exe [...]

    Have you added this dll to the list of project modules to be profiled?

    Can you attach here your AQtime project (and .exe and .dll) ?

    • fred_temento's avatar
      fred_temento
      Occasional Contributor

      Hi Alex,


      thanks for your feed back.


      >Have you added this dll to the list of project modules to be profiled?

      of course ! 

      I did it manually on my standalone AQtime project and it was done automatically by the intergrated version.

      So, I think it's done !


      >Can you attach here your AQtime project (and .exe and .dll) ?

      I zip it... I suppose that an AQTime project is only made of the *.aqt file !

      For information the fake memory leak is in the TSFC.dll module, TSString.cpp file, CTSString class default ctor which is called many times (I check with a breakpoint in debug mode)


      Here is the code:

      CTSString::CTSString ()
      {
      m_Size = 0;
      m_BufferSize = STARTING_BUFFER_SIZE;
      m_pBuffer = NULL;
      SetNeededBufferSize (false);
      m_pBuffer[0] = 0;

      char * p = (char *)malloc(10); // p is never free to check for ML

      }


      You will see, with Windbg, that the MSVCRT embeded memory check, see my fake memory leak (but without reporting line information)


      Detected memory leaks!
      Dumping objects ->
      {650} normal block at 0x006FE5D8, 10 bytes long.
      Data: < > CD CD CD CD CD CD CD CD CD CD


      You'll find attached a 7Z file containing my AQTime (standalone version) projet and minimal subset version of my exe with it's DLL as requested.


      (I cannot use ZIP since the ZIP file is more than your limit of 20,000,000 bytes !)


      Running Diatem.exe stops at checking licence time but it's not an issue since the CTSString default ctor is called a lot of time before this. So it's enought for test prupose.


      Thanks for your help.


      • AlexKaras's avatar
        AlexKaras
        Champion Level 3

        Hi,


        Thank you for the project.

        This is what I did after I unpacked the archive and opened it in AQTime:

        a) As AQTime stores full path to the profiled modules in the project and provide no means to batch 'rebase' them, I had to remove all modules from the project and add them a-new and marked DiaTem.exe as the Active module;

        b) Initial launch of DiaTem.exe failed for me because of absence of the required mfc120d.dll, msvcp120d.dll and msvcr120d.dll DLLs. DiaTem.exe started successfully after I downloaded the mentioned DLLs (mine box does not have VC2013 debug redistributables);

        c) I noted, that none of the binaries in the archive contains debug information;

        d) In the Setup | Classes To Profile panel I created a new area of including type, added TSFC.dll to it and made this area the only selected one;

        e) Started profiling.


        I tried both: to press Get Results button in AQTime while the License window is on screen and to wait for the final results after the window was closed and the DiaTem.exe exited.

        Initially, indeed, I got an empty results on the Report panel. But after I deactivated the View Project Classes Only filter (a button in the middle of the toolbar just above the results I saw a line with the leak of C++ Native Memory type.

        After I double-clicked this line to select it (and pressed the View Allocation Paths In Call Tree button) I was able to see a couple of reported leaks of 10 bytes each in the Call Graph and Call Tree panels. No module name / line number info was provided because (I think) no debug information was provided.

        I was able to see every separate leaked allocation after I selected Objects node in the results tree.

        I was not able to check if you has got the same results because you did not include the folder with report data (named diatem3.6_Results) in the archive.


        Attached is my project file with the results and a screenshot of profiling results.


        Does the above help?