Forum Discussion

kkchan's avatar
kkchan
Contributor
13 years ago

Total of request Response time not equal to connection times

Hi

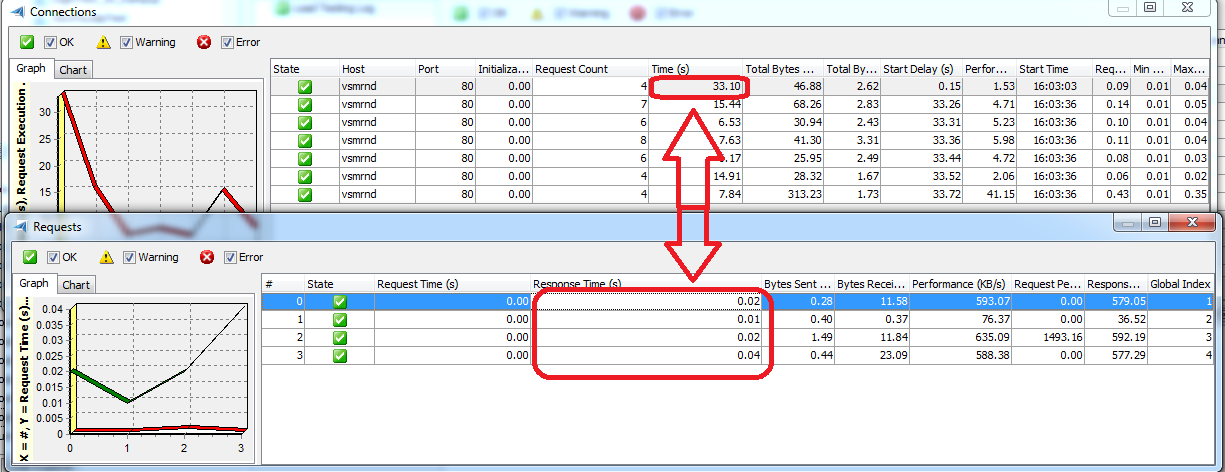
By referring to the log result as attached, the times (s) shown in connection #1 doesn't not tally with the total of response time of corresponding request. Any ideas? My expectation is, they should be the same/almost the same. Otherwise, may I know why did those time go?


In fact, when I test it manually, it doesn't take me more than 3 seconds. However, by using TC, it at least took me 22 secs even that is only 1 vuser.


Please advice. Thank you

5 Replies

  • ArtemS's avatar
    ArtemS
    SmartBear Alumni (Retired)
    Hi,

    The connection lifetime is always greater than the overall duration of the connection's requests and responses. Sometimes, it is even significantly greater.

    This is because the connection time includes the following components:

      1) load testing engine initialization time;

      2) connection initialization time;

      3) time needed to simulate requests and receive responses;

      4) connection finalization time;

      5) time needed to log results.


    See HTTP Load Testing - Timing Task Execution online help topic for details.
  • Hi

    Thank for info

    Then, how could I know if my application is really react under the expected time frame? It seem like too many things to be excluded, and somemore some are not excluded (such as time to log result)...

    Anyway from TC to show us the "actual/nearest to actual" the time taken? Otherwise, it is very difficult for us to analyze the performance. We might also want to use the log result and send to customer for reference. Or may be any add-on tool can be provided for this purpose?


    Thank you
  • ArtemS's avatar
    ArtemS
    SmartBear Alumni (Retired)
    Hi, Chan

    To estimate the application reaction, you can use the sum of request and response time (the sum of the Request Time and Response Time columns of the Requests panel). This sum indicates the pure time it took the server to receive the requests, process them and send the responses.  In the screenshot you have attached, this sum will be (0+0+0+0)+(0.02+0.01+0.02+0.04)=0.09 seconds.


    As for sending the results to a customer, you may send them directly from TestComplete (see Sending Results via E-Mail ) or export the results to an intermediate format (XML, MHT, PDF) and send the exported files manually (see Exporting Test Results).
  • Hi

    I hope TC can have a additional column to show the "actual" time taken (sum of all requests) at user panel because as I think a developer/QA/customer are more interested on this time instead of the time that including engine initialization and etc.


    Thank you
  • ArtemS's avatar
    ArtemS
    SmartBear Alumni (Retired)
    Hi,

    The Connections panel actually has such a column - Request Execution Summary. It shows the overall time spent to execute all of the requests of the given connection.

    Unfortunately, the Users panel does not have a similar column. We have such a suggestion in our DB, and your request has increased its rating.

    Thank you.