Full page response time on the dashboard
we do not see full page response time on the dashboard, whereas what we get is Last response of the monitor. is there any way to include full page response time to dashboard. Please implement this feature, this will help the clients to understand the full-page load time without drilling down to the details.700Views5likes5Comments
Report Types and Their Date Ranges
Each Report type has a set date range that determines how much data can be aggregated to generate the report. Depending on the report type, you can select one, several, or all monitors. The Date range for report types in both single selection and multi-monitor selection have been provided below: Singe Monitor Selection Multi-Site Selection Report Type: Date Range: Report Type: Date Range: Detail 31 Days Monitor Summary 92 Days Hourly 31 Days Site Status Report Today Only Daily 184 Days SLA Summary 366 days Regional Breakdown 184 Days Summary Statistics 92 days. Statistics By Hour of Day 92 Days Usage Report 999 Days SLA Detail 92 Days Usage Report Summary 999 Days SLA Summary 366 days Notifications Detail 184 Days ContentView Summary 31 Days Outage Detail 92 days. Transaction Step 184 Days Transaction Step Summary 184 Days Page Objects 31 Days Notifications Detail 184 Days Outage Detail 92 Days665Views2likes0Comments
Interface for seeing queued emails for an Insite appliance
Sometimes we have an issue where alert emails stop sending on certain insite appliances. The emails get queued up and when we restart the appliance, they get sent. It would be good to be able to actually see the email queue on the appliance so that we can check this if we stop getting emails. An interface on the Admin site would be great.227Views1like0Comments
Displaying the data based on custom time zone or based on end user's device/browser timestamp
On the SmartBear AlertSite UI, instead of fixing the data timestamp to GMT, it would be better if we can configure the timestamp of the displayed data (Or) may be, the data can simply be displayed based onend user's device/browser timestamp.1.1KViews1like2Comments
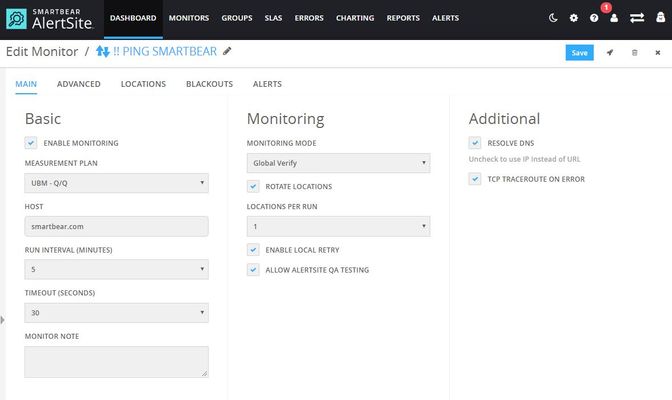
What metrics does a PING monitor capture?
Because PING monitors use ICMP, they do not display traditional metrics in Detail Reports. There is, however, a DNS lookup time and a Total Response Time reported. The Total Response Time for these monitors is the time it takes to PING the requested host over ICMP.1.1KViews1like0Comments