Problem to validate chart on website
SOLVED- Bookmark
- Subscribe
- Subscribe to RSS Feed
- Permalink
- Report Inappropriate Content
Problem to validate chart on website
Hi there,
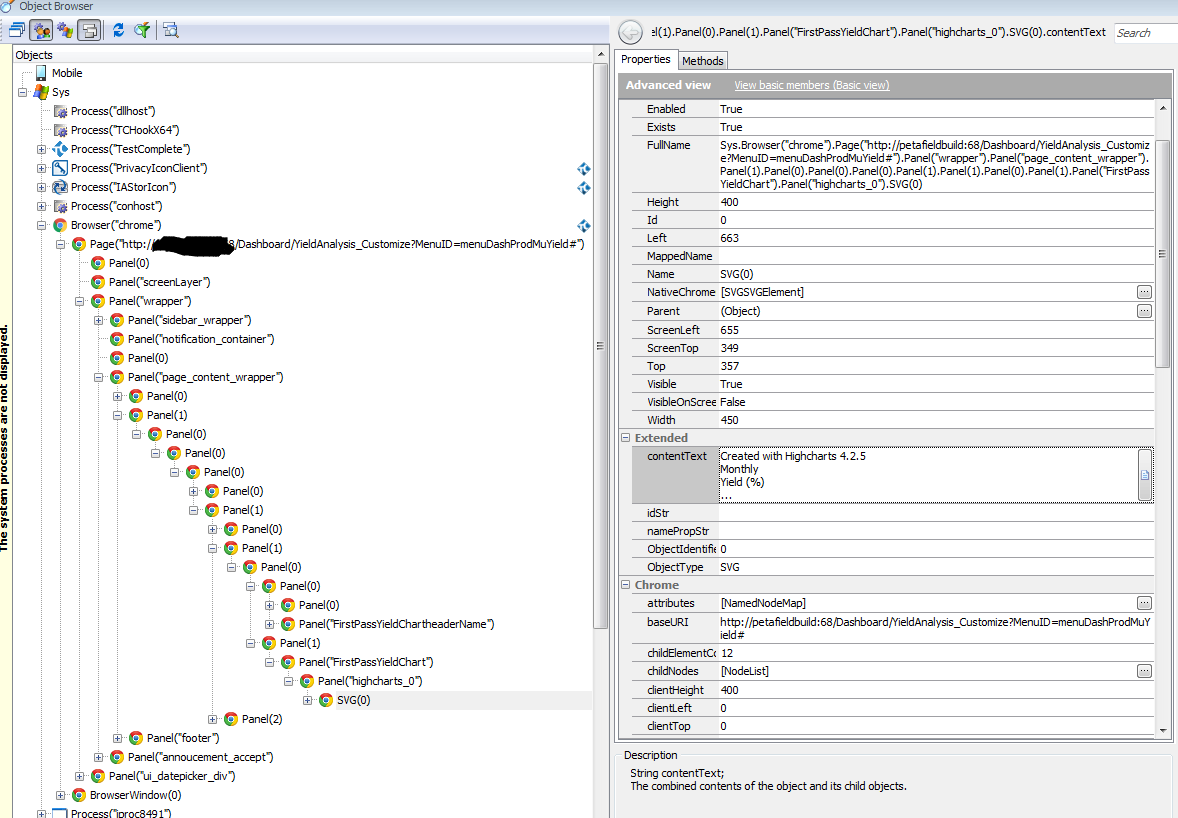
I have test complete license for desktop.Right now, my team exploring test complete web. I'm using trial version to try out the web features and found one issue. we have a lots of chart and table need to validate. when i spy the chart, i found some data label on the chart cannot be captured by test complete. let say i have 13 bars on the chart, it only capture 1 bar as below picture. Do you have any suggestion to solve this issue?
Thanks: )
Solved! Go to Solution.
- Bookmark
- Subscribe
- Subscribe to RSS Feed
- Permalink
- Report Inappropriate Content
Hi,
> Do you have any suggestion to solve this issue?
I am afraid to say that no, we don't.
The reason is that we have absolutely no idea about what chart you are trying to work with, how it is recognized by TestComplete's Object Browser, is it implemented in-house or provided by some third-party control, etc.
We also don't know what do you like to validate: the image of the chart, if expected data is used as its data source, something else...
To validate the images of the chart, you may prepare a set of test data, command the chart to visualize them and use TestComplete's image comparison functionality to check that the displayed image remains the same.
If the chart is provided by some third-party control, you may decide not to check if visualization is done correctly (assuming this was done by control's provider) but just to validate that expected data were used to display the chart. You may talk to developers to discuss how this can be done.
/Alex [Community Hero]
____
[Community Heroes] are not employed by SmartBear Software but
are just volunteers who have some experience with the tools by SmartBear Software
and a desire to help others. Posts made by [Community Heroes]
may differ from the official policies of SmartBear Software and should be treated
as the own private opinion of their authors and under no circumstances as an
official answer from SmartBear Software.
The [Community Hero] signature is used with permission by SmartBear Software.
https://community.smartbear.com/t5/custom/page/page-id/hall-of-fame
================================
- Bookmark
- Subscribe
- Subscribe to RSS Feed
- Permalink
- Report Inappropriate Content
Can you show how your chart looks in the Object Browser?
- Bookmark
- Subscribe
- Subscribe to RSS Feed
- Permalink
- Report Inappropriate Content
- Bookmark
- Subscribe
- Subscribe to RSS Feed
- Permalink
- Report Inappropriate Content
Ok. And how looks SVG(0) element (whole chart) on the page?
- Bookmark
- Subscribe
- Subscribe to RSS Feed
- Permalink
- Report Inappropriate Content
Hi,
It looks that the chart is implemented using SVG (segmented vector graphic)... When I tried it some time ago, I also was not able to get much about it from TestComplete. I also do not remember any explicit notes about improvements in SVG support in the release notes for the latest versions of TestComplete.
My suggestion is:
-- To talk with developers and ask them how you can get from the test the data used to display the chart and stick to validation that the data are correct and leave the verification of how correct data are visualized to the provider of the chart control;
-- You may additionally create a small amount of tests that do image comparison using sets of test data of special interest to verify that the chart is displayed correctly (e.g. zero values, values between 0 and 1, etc.);
-- Create a Support case via the https://support.smartbear.com/message/?prod=TestComplete form and ask guys if they have any recommendations on how to work with SVG.
/Alex [Community Hero]
____
[Community Heroes] are not employed by SmartBear Software but
are just volunteers who have some experience with the tools by SmartBear Software
and a desire to help others. Posts made by [Community Heroes]
may differ from the official policies of SmartBear Software and should be treated
as the own private opinion of their authors and under no circumstances as an
official answer from SmartBear Software.
The [Community Hero] signature is used with permission by SmartBear Software.
https://community.smartbear.com/t5/custom/page/page-id/hall-of-fame
================================
- Bookmark
- Subscribe
- Subscribe to RSS Feed
- Permalink
- Report Inappropriate Content
Hi baxatob,
It looks like this. The child elements shows as TextNode.
- Bookmark
- Subscribe
- Subscribe to RSS Feed
- Permalink
- Report Inappropriate Content
Thanks Alex, I ask customer request team.
- Bookmark
- Subscribe
- Subscribe to RSS Feed
- Permalink
- Report Inappropriate Content
I agreed with @AlexKaras, currently you only can create a number of image comparison tests, if you need to validate how it looks on the screen.
If it's enough to validate that data was changed after some action was done, you can do it using direct requests to database server or by parsing http-responses.
- Bookmark
- Subscribe
- Subscribe to RSS Feed
- Permalink
- Report Inappropriate Content
What do the child nodes contain?
It looks like there is one for each bar in your chart? (Going by the numbers mentioned in your original post)
As @AlexKaras mentioned, it sounds like support for these is limited. But you are at least getting some text out of them. I'm guessing your initial post with a list in it was taken from the SVG object? As the text I can see in the screen capture from the child node is not text that's in that list?
So it may be worth having a VERY thorough poke through the child nodes and see if there is anything else in there you can use? And by thorough, I mean drilling down into every property AND field (if present - not sure they are) available in there ....
As the others have said. Image compare are an option. Albeit a fragile one. You could also have a look at using OCR perhaps? I'm not sure without seeing a graphic representation of the chart or what you want to get from it. I ended having to use OCR on some panels in my application which are Canvases, so essentially just a giant image with no child objects and few useful properties. (It has a background XML map of hotspots. It actually contains a LOT of user controls, but it's the graphic representation I'm interested in. Not the XML. That's a separate issue.)
