Why is Performance Profiler indicating no routines analyzed
This is almost embarrassing. I was an AQTime user 12 years ago and earlier using it with Delphi.
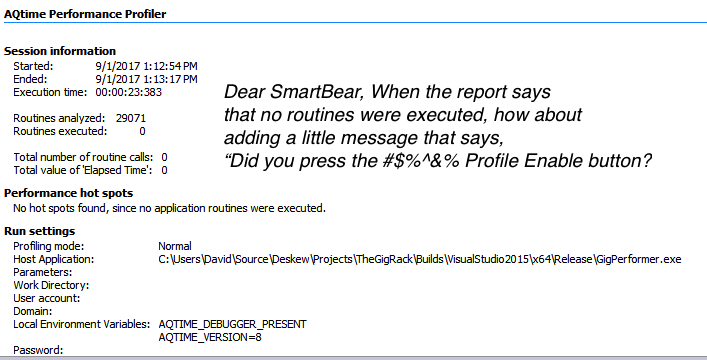
Now, I'm working on a project in C++ (just native) and, with a brand new license, I'm trying to use it to do a basic Performance Profile of my code. While I'm pretty sure I've followed all the instructions to make it work (https://support.smartbear.com/viewarticle/43100/) , after I do a brief run, where AQTime is clearly doing something since my application runs blatantly slowly, the summary tell me that 0 routines have been analyzed and 0 routines executed. So there's no call graph, call tree, etc.
The main executable shows up as a module, and "All Project Modules" (routines only) is checked in the "Code to Profile"
What have I forgotten to do?
Thanks in advance
Sigh!
(Edit: Sorry - couldn't resist creating the image. In case nobody looked, the problem was because the button "Enable profiling" was off. For me, coming from Mac, the tooltip was misleading. When I saw the tooltip "Enable profiling", I assumed that meant that profiling WAS in fact enabled, and not that I needed to click it to enable profiling.