DavidJameson
8 years agoOccasional Contributor
Why is Performance Profiler indicating no routines analyzed
This is almost embarrassing. I was an AQTime user 12 years ago and earlier using it with Delphi. Now, I'm working on a project in C++ (just native) and, with a brand new license, I'm trying to use i...
- 8 years ago
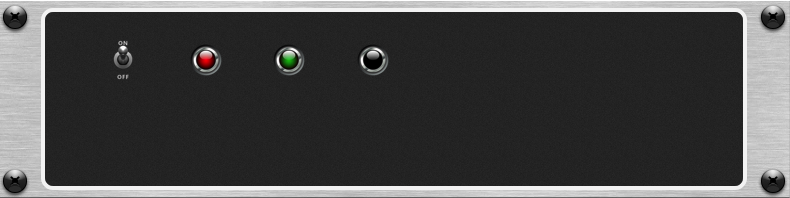
Sigh!
(Edit: Sorry - couldn't resist creating the image. In case nobody looked, the problem was because the button "Enable profiling" was off. For me, coming from Mac, the tooltip was misleading. When I saw the tooltip "Enable profiling", I assumed that meant that profiling WAS in fact enabled, and not that I needed to click it to enable profiling.