Forum Discussion
AlexanderM Staff
Staff
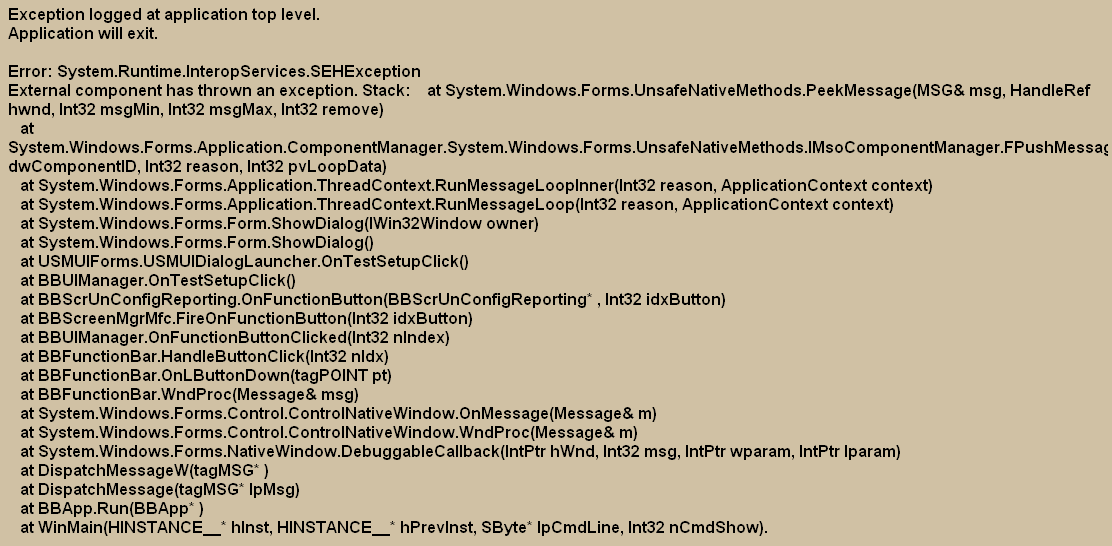
15 years agoStaffHi Patricio,
Please answer the following questions:
1. What TestComplete version are you using?
If it is earlier than TC 7.52, upgrade to version 7.52 and check whether the problem persists.
2. Was .NET Framework 4 installed on this PC? If it was, most probably, you face a known issue for which we have a patch. See this article for more information.
If the problem still persists with TC 7.52, we need you to collect some additional information. Please follow the steps below:
1. Download a free trial version of AQtime 6, which is our profiling tool, from our web site. The trial can be requested here.
2. Install the tool.
3. Start AQtime with the -NotOpenApp command line argument. For example, you can use the following command line:
"c:\Program Files\Automated QA\AQtime 6\Bin\AQtime.exe" -NotOpenApp
4. Select the 'File | New Project From Module...' main menu item.
5. In the Open File dialog, select the executable file of the tested application and click Open.
6. Take a look at the AQtime toolbar - there is a combo box. Open it and select the "Tracing | Exception Trace Profiler" item.
7. Select the "Options | Options..." main menu command - the Options dialog will appear.
8. Set the "Profiling Time | Event View | General | Exceptions | Depth shown" setting to 100 and click OK.
9. Click the Run toolbar button (the green arrow) or press F5 to start the profiling.
10. AQtime will start the tested application and trace all exceptions that will occur in the application until it is closed.
11. Reproduce the problem.
12. After the problem occurs, right-click somewhere within the Event View panel (it is opened by default at the bottom of AQtime's window) and select the 'Save All...' item.
13. Save the panel's contents to an HTML file and send the file via our Contact Support form.
Also, please generate a memory dump for TestComplete when it hangs. To generate it, please follow the steps below:
1. Repeat steps 3 and 4.
2. In the Open File dialog, select the TestComplete.exe file and click Open.
3. Click the Run toolbar button (the green arrow) or press F5 to start the profiling.
4. Once TestComplete hangs, wait for five minutes and generate a dump by clicking the "Generate Process Dump" button on the Event View panel's toolbar - the panel is at the bottom of AQtime's window and the toolbar is at the top of the panel.
If you don't see the button (it may be hidden by default):
- right-click the toolbar;
- select Customize;
- switch to the Commands tab;
- select the Event View category;
- drag the "Generate Process Dump" command from the Commands list and drop it to the Event View panel's toolbar.
5. Save the Event View panel's contents to an HTML file.
6. Send the generated dump file along with the Event View contents via our Contact Support form.
Thanks in advance.