Forum Discussion
16 Replies
- Hi!
Can you add a screenshot for the actual LoadTest window after the LoadTest has been run so we can see the statistics table?
regards!
/Ole
eviware.com  abhishek813Frequent Contributor
- Hi!
thanks..
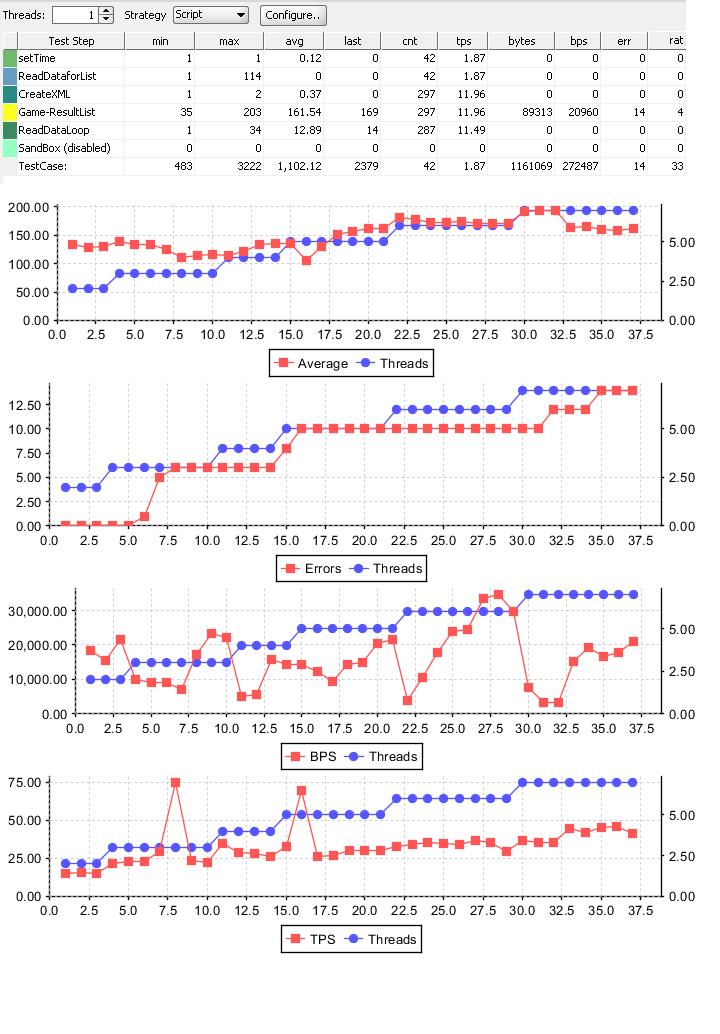
- the first graph shows the avg response time (red) vs number of threads (blue)
- the second graph shows the number of errors (red) vs number of threads (blue)
- the third graph shows the avg number of bytes-per-second (red) vs number of threads (blue)
- the fourth graph shows the avg number of transactions-per-second (red) vs number of threads (blue)
does that make sense?
regards!
/Ole
eviware.com - abhishek813Frequent ContributorOk, Another question....
in the first graph, the axis on the left is for Average and the one on the right is for Thread then what is the bottom axis for?
-Abhishek - Hi!
time.. from left to right..
regards!
/Ole
eviware.com  Beno_IskratelFrequent Contributor
eviware support wrote:
...
time.. from left to right..
...
sometimes i get confuzed with this one.
in abhishek example, 37.5?
what time is this?
is this seconds, minutes, hours, number of samples?- Hi,
hmm.. how long did your test run?
regards,
/Ole
eviware.com - Beno_IskratelFrequent Contributor
eviware support wrote:
...
hmm.. how long did your test run?
...
that's the problem, right?
you cannot know this if you look at the graphs.
regards,
beno - Hi Beno,
yes.. good point.. I'll put that as a bug in our backlog...
regards,
/Ole
smartbear.com  RKONDRUOccasional Contributor
eviware support wrote: I'll put that as a bug in our backlog...
Ole,
Just catching up on this issue myself. Could you add to this enhancement request not only the time but the date. It makes for more understandable/accurate reports.
Thanks,
Scott
