Forum Discussion
SmartBear_Suppo Alumni
15 years agoAlumniHi!
thanks..
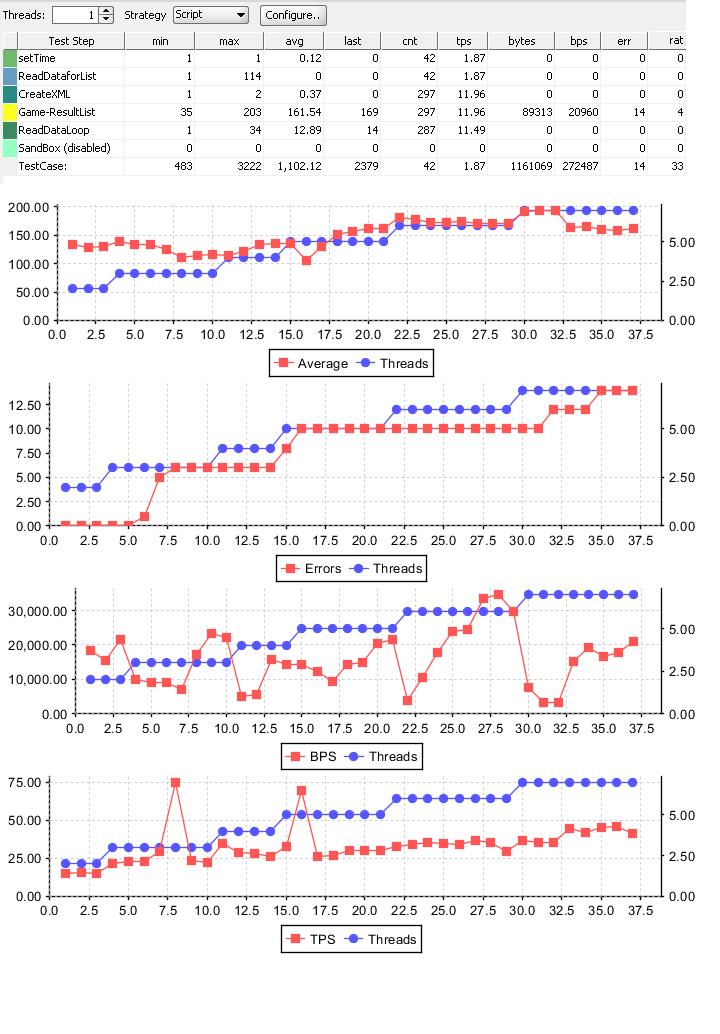
- the first graph shows the avg response time (red) vs number of threads (blue)
- the second graph shows the number of errors (red) vs number of threads (blue)
- the third graph shows the avg number of bytes-per-second (red) vs number of threads (blue)
- the fourth graph shows the avg number of transactions-per-second (red) vs number of threads (blue)
does that make sense?
regards!
/Ole
eviware.com
thanks..
- the first graph shows the avg response time (red) vs number of threads (blue)
- the second graph shows the number of errors (red) vs number of threads (blue)
- the third graph shows the avg number of bytes-per-second (red) vs number of threads (blue)
- the fourth graph shows the avg number of transactions-per-second (red) vs number of threads (blue)
does that make sense?
regards!
/Ole
eviware.com