Gadgets enhancement request
Request to get gadgets to generate the total number of testcases created in the specific timeline (sprint to qtr or month etc) and how many automated for all or multiple projects. Currently, we have gadgets that support only single project but need to be used across all or multiple projects.Where is the gadget "Test Execution Progress" in Zephyr Squad Cloud?
In Server/Data Center, there's a gadget named "Test Execution Progress" that looks like a colored donut chart. In Cloud, I am unable to find it. Instead there's a "Test Progression" in Cloud but it doesn't look the same. Is Test Execution Progress gadget no longer available in Cloud?42Views0likes0CommentsWhat would cause a Jira JQL, that uses ZQL, to run extremely slow?
Greetings community. I'm Jeramy and I'm the Atlassian Administrator for a software company that makes logistics software. Lately, we've noticed a huge performance issue when running Jira JQL's that contain ZQL code inside of them. We are running Jira in Azure, with multi-node configuration, and on the latest hardware (each VM has 32 GB of ram and a new Intel processor). We are on Zephyr Squad version: 9.3.0.93009768. When I tested a JQL search, it took almost two minutes to return the results. However, if I take out the ZQL part, it takes seconds to retrieve the data. What else can I post here that might help? Thanks!199Views0likes0Commentszephyr Scale snowflake integration using Fivetran
Does anyone integrated zephyr test results into snowflake DB for BI analytics ? I know FIVETRAN tool available for JIRA. do we have any other options other than using API ?. Does any one know how zephyr stores the cycle data ? does it uses its won DB. Am using zephyr squad. ?295Views0likes0CommentsZephyr Gadgets to Jira Dashboard
Hi, How can I visualize the same information on Jira Dashboard when using Zephyr Squad as I would with Gadget: "Zephyr Scale - Test Execution - Test execution completion over time by status"? In other words, How to show a cumulative information on how many test cases have been executed over certain amount of time? All "time" gadgets on my Jira instance show only how long an execution takes, which is not interesting in this case.356Views0likes0CommentsBurn Down Chart Dashboard gadget does not display accurate burn down
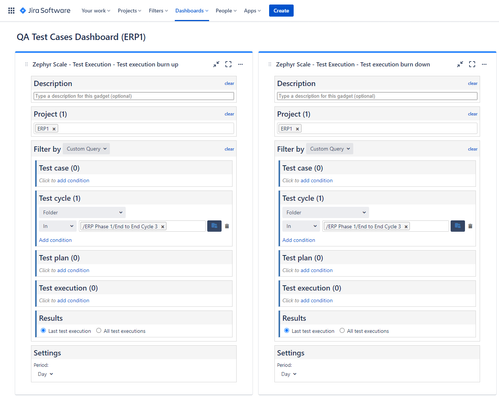
When building a Dashboard containing Burn Up and Burn Down charts using the SmartBear Zephyr Scale gadgets in Jira Cloud, the results displayed in the Burn Down chart are simply a mirror-image of the results displayed in the Burn Up chart, not accurately displaying the Execution Remaining results as expected. Configuration: Results: Using identical configuration specs, the Burn Up chart shows we tested 21 Test Executions (of 771 total) on June 09, 2021. The corresponding Burn Down chart does not represent that on June 09, 2021 we should have 750 Test Executions remaining. Is anyone else seeing these type of results from these gadgets? We are trying to build dashboards for management to be able to track real-time results, but the gadgets don't appear to calculate the data correctly.Solved2.6KViews1like3CommentsGadget for reporting across multiple Projects
Hi All, Does anyone know if it's possible to report on Cycle names across multiple projects. Or to even create a JQL where I can reference the Cycle name. My problem is that I have to report on tests across a lot of Jira projects and moving the test cases into a single Project isn't feasible.866Views0likes1CommentPresent test executions progres from "Manage test execution"?
Hello. I work in a very big project with thousands of testcases in Zephyr and we use coponents to sort the cases. To see the progress in testexecution, we make and store/save filters in "Manage test execution" with component and status on testexecution (unexecuted, fail, Wip, Blocked and pass) - thats ok - But my question is - have to present those numbers in the best way? There are dashboards, but i do not want to put in release and we dont need the details of the cases - the project manager wants to see the status of testexecution only with : project name, component and status on testexecution ( wip, pass and so on) - not the details, only the numbers. Anyone who have tip? Thanks!653Views1like0CommentsTest Progression gadget in JIRA dashboard shows unexpected "Unscheduled tests"
Hi all, I'm having an issue with the gadget Test Progression on JIRA dashboard. Although I haven't added any tests to the cycle, it shows that I have 40 unscheduled tests. In the horizontal axis, it is supposed to show days but it only displays only one column during the past few days (I have configured the gadget to show 3 days). Could anyone with experience tell me what possibly went wrong?1.1KViews0likes1Comment

