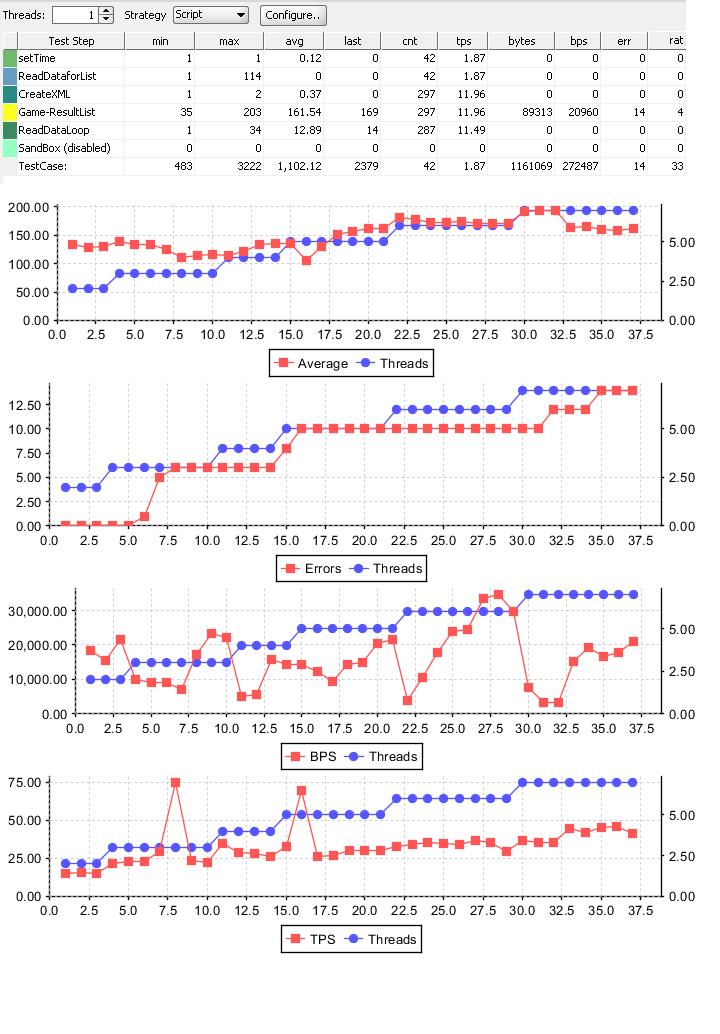
abhishek813Frequent Contributor15 years agoHow to read Graphs generated for Load testI have executed load test using SoapUI. The report generated have graphs. Could you please explain how to read these graphs. (screenshot attached) ThanksGraph.JPG126 KB
Recent Discussions4.0.1 Not marking test as passedWhich Log4j VersionReadyAPI 4.0.1: How to see overview of open messages
Related ContentHave you tried auto-case generation in QMetry?Performance issue when reading large number of objectsAI-based API test generation