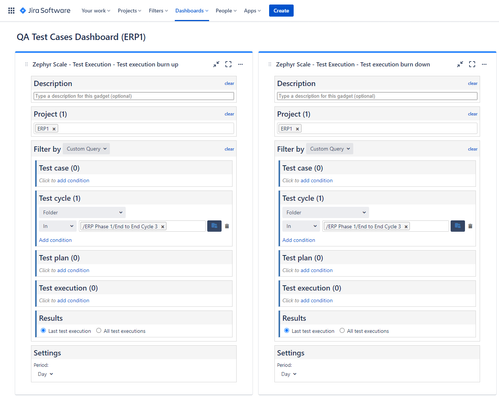
Burn Down Chart Dashboard gadget does not display accurate burn down
When building a Dashboard containing Burn Up and Burn Down charts using the SmartBear Zephyr Scale gadgets in Jira Cloud, the results displayed in the Burn Down chart are simply a mirror-image of the results displayed in the Burn Up chart, not accurately displaying the Execution Remaining results as expected. Configuration: Results: Using identical configuration specs, the Burn Up chart shows we tested 21 Test Executions (of 771 total) on June 09, 2021. The corresponding Burn Down chart does not represent that on June 09, 2021 we should have 750 Test Executions remaining. Is anyone else seeing these type of results from these gadgets? We are trying to build dashboards for management to be able to track real-time results, but the gadgets don't appear to calculate the data correctly.Solved2.3KViews1like3Comments
