Unable to launch a profiler (Performance or Allocationà
Hi, I can't use AQTIME since several weeks. When I start the profiler, the process stops and do nothing. I reinstalled AQTIME but the same problem remains. I have a log message saying: "Event Thread ID Time User breakpoint is at address 0xFFE009AB (module Unknown module) 11296 09:33:31:667" Can you help me? BR Minh-Huy351Views0likes0CommentsAQtime 8.20 and C++Builder XE5 not working
Hi, I have to profile a project within XE5 with AQtime 8.2 but whne I lounch the command "Run with profiler" it seems starting but it stop to do anithing after some second. The module attached does not starts the any profiled data were collected. Do you have some suggestion to fixing it? I tried to biuld my 32 bit project on Windows 10 64 bit and Windows 11 64 bit Thanks for attention GZ475Views0likes0Commentswhat next
i have been hacked some times ago that disarranged and disorganized all my system so i need a single working space for myself only now, either in my device system or in my internet services in any other ways, also a strongroom protections for all my works and accounts and make it invisible and impossible for hackers and trackers from having access over my system no matter how greate the hacker system is, also make their command trigger back to them without touching my sytem.902Views0likes0CommentsAQTimePro access violation when try new project
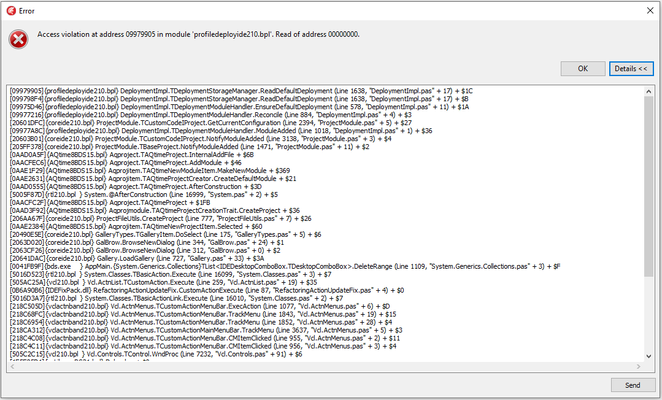
Hi, I'm just starting on it to test AQTimePro with Delphi XE7, but when I try to create a new project I'm getting an Access Violation error, I did some search about it but I did not find nothing, can you let me know if there is something that I can do to fix it ? I think the process is not working because of this error. Thanks.5.9KViews0likes9CommentsERangeError on program start up using the Performance Profiler in Delphi 10.1 Berlin
To improve the performance of our program, we've recently started to use AQtime Pro 8, but we're facing the following issues: After selecting all modules of our executable and running the program with profiling activated, we're getting a madExcept error message (see below) The error also occurs when disabling madExcept and doesn't occur when starting the program directly or in debug mode in Delphi. The instrumenting modules procedure doesn't return any errors. We can avoid the error, when excluding some of the program's units. Unfortunately, the units we have to exclude, are exactly the units we want to analyze. Following settings are active: Thread model: Win32 threads Active counter: Elapsed Time Profile <Root> routine NOT selected Disable inlining NOT selected Profile .NET runtime NOT selected Changing these settings never led to a working outcome, though. Error message: ERangeError call stack: main thread ($4064): 00416c5d +5d XXX.exe System 34247 +9 DynArraySetLength 0041705c +2c XXX.exe System 34384 +9 @DynArraySetLength thread $3e5c: 7fff9705 +0e KERNEL32.DLL BaseThreadInitThunk 7fff9719 +1b ntdll.dll RtlUserThreadStart thread $6804: 7fff9705 +0e KERNEL32.DLL BaseThreadInitThunk 7fff9719 +1b ntdll.dll RtlUserThreadStart thread $79c: 7fff9705 +0e KERNEL32.DLL BaseThreadInitThunk 7fff9719 +1b ntdll.dll RtlUserThreadStart thread $2588: 7fff9705 +0e KERNEL32.DLL BaseThreadInitThunk 7fff9719 +1b ntdll.dll RtlUserThreadStart thread $497c: 7fff9705 +0e KERNEL32.DLL BaseThreadInitThunk 7fff9719 +1b ntdll.dll RtlUserThreadStart thread $5f10: 7fff93f4 +f7 KERNELBASE.dll WaitForMultipleObjectsEx thread $3920: 7fff9705 +0e KERNEL32.DLL BaseThreadInitThunk 7fff9719 +1b ntdll.dll RtlUserThreadStart thread $5388: 7fff9705 +0e KERNEL32.DLL BaseThreadInitThunk 7fff9719 +1b ntdll.dll RtlUserThreadStart thread $5354: 7fff93f4 +f7 KERNELBASE.dll WaitForMultipleObjectsEx 7fff9705 +0e KERNEL32.DLL BaseThreadInitThunk 7fff9719 +1b ntdll.dll RtlUserThreadStart thread $5398: 7fff93f2 +8c KERNELBASE.dll WaitForSingleObjectEx 7fff9705 +0e KERNEL32.DLL BaseThreadInitThunk 7fff9719 +1b ntdll.dll RtlUserThreadStart thread $466c: <priority:2> 7fff93f4 +f7 KERNELBASE.dll WaitForMultipleObjectsEx 7fff9705 +0e KERNEL32.DLL BaseThreadInitThunk 7fff9719 +1b ntdll.dll RtlUserThreadStart thread $59d8: 7fff93f2 +9a KERNELBASE.dll SleepEx 7fff9705 +0e KERNEL32.DLL BaseThreadInitThunk 7fff9719 +1b ntdll.dll RtlUserThreadStart thread $56f4: 7fff93f2 +8c KERNELBASE.dll WaitForSingleObjectEx 7fff9705 +0e KERNEL32.DLL BaseThreadInitThunk 7fff9719 +1b ntdll.dll RtlUserThreadStart thread $457c: 7fff93f2 +8c KERNELBASE.dll WaitForSingleObjectEx 7fff9705 +0e KERNEL32.DLL BaseThreadInitThunk 7fff9719 +1b ntdll.dll RtlUserThreadStart thread $5954: 7fff93f2 +8c KERNELBASE.dll WaitForSingleObjectEx 7fff9705 +0e KERNEL32.DLL BaseThreadInitThunk 7fff9719 +1b ntdll.dll RtlUserThreadStart thread $5130: 7fff93f2 +8c KERNELBASE.dll WaitForSingleObjectEx 7fff9705 +0e KERNEL32.DLL BaseThreadInitThunk 7fff9719 +1b ntdll.dll RtlUserThreadStart thread $66e4: 7fff93f2 +8c KERNELBASE.dll WaitForSingleObjectEx 7fff9705 +0e KERNEL32.DLL BaseThreadInitThunk 7fff9719 +1b ntdll.dll RtlUserThreadStart thread $6920: 7fff93f2 +8c KERNELBASE.dll WaitForSingleObjectEx 7fff9705 +0e KERNEL32.DLL BaseThreadInitThunk 7fff9719 +1b ntdll.dll RtlUserThreadStart thread $686c: 7fff93f2 +8c KERNELBASE.dll WaitForSingleObjectEx 7fff9705 +0e KERNEL32.DLL BaseThreadInitThunk 7fff9719 +1b ntdll.dll RtlUserThreadStart thread $4818: 7fff93f2 +8c KERNELBASE.dll WaitForSingleObjectEx 7fff9705 +0e KERNEL32.DLL BaseThreadInitThunk 7fff9719 +1b ntdll.dll RtlUserThreadStart thread $2898: 7fff93f2 +8c KERNELBASE.dll WaitForSingleObjectEx 7fff9705 +0e KERNEL32.DLL BaseThreadInitThunk 7fff9719 +1b ntdll.dll RtlUserThreadStart2.6KViews0likes1CommentDuplicate Routines entry/exit
I don't understand. Why can I not Start profiling when entering a function and Stop profiling when exiting the same function? I would think that this would be a very common thing to do. For that matter, why is there a limit of only one anyway? I can think of other use cases, such as where I'd want to stop and generate a report at the exiting of a function. What's up with this? Why the limitation?4KViews0likes5CommentsNo source access with allocation profiler
Hey guys, I am experiencing problems accessing the source files in the editor's tab if I use the allocation profiler. Search paths are set up correctly since I can perfectly view the source (and the line per line analysis) if I use the performance profiler. As soon as I switch over to the allocation profiler no source is available. Of course the executable remains untouched, so it is the same for the two profiler runs. It's a Win32 Delphi Application. The configuration was done according to https://support.smartbear.com/viewarticle/54592/ I followed these two tutorials for the allocation profiling: https://support.smartbear.com/articles/aqtime/fixing-memory-leaks-with-aqtime/ and https://support.smartbear.com/viewarticle/43862/ I tried the troubleshooter but could not find a solution concerning my problem. It works perfectly with performance but not allocation profiler. Is there any kind of difference between them (concerning source code)? Thanks in advance, Alex3.5KViews0likes2CommentsSupport Fibers API
Currently, Performance Profiler causes program crash when profiling code using Fibers API(see Case #00169159: Program halts when run under Performance Profiler). To reproduce: 1) Compile attached Delphi program. Note it uses Fiber API to implement generator: https://msdn.microsoft.com/en-us/library/ms682661.aspx 2) Run it. The output is 2 3 5 3) Open in AQTime, select Performance Profiler, All Project Modules. Run. The program halts. Event View window shows: Event Thread ID Time Project run selected, current profiler is Performance Profiler. 18:27:24:533 Process create ID: 5572, Thread ID: 8316, Base address: 0x00400000 8316 18:27:24:544 Module loaded: fiberdemo.exe; Base address: 0x00400000 File Size: 1155763 Version: 0.0.0.0 8316 18:27:24:545 Module loaded: C:\Windows\SysWOW64\ntdll.dll; Base address: 0x778D0000 File Size: 1535032 Version: 10.0.10240.16683 8316 18:27:24:549 Module loaded: C:\Windows\SysWOW64\kernel32.dll; Base address: 0x751F0000 File Size: 624312 Version: 10.0.10240.16384 8316 18:27:24:551 Module loaded: C:\Windows\SysWOW64\KernelBase.dll; Base address: 0x75540000 File Size: 1531368 Version: 10.0.10240.16683 8316 18:27:24:552 Module loaded: C:\Windows\SysWOW64\oleaut32.dll; Base address: 0x76CA0000 File Size: 591912 Version: 10.0.10240.16384 8316 18:27:24:623 Module loaded: C:\Windows\SysWOW64\msvcrt.dll; Base address: 0x74EF0000 File Size: 773168 Version: 7.0.10240.16384 8316 18:27:24:624 Thread create ID: 4916; Priority: Normal 4916 18:27:24:626 Module loaded: C:\Windows\SysWOW64\combase.dll; Base address: 0x74BB0000 File Size: 1811360 Version: 10.0.10240.16683 8316 18:27:24:942 Module loaded: C:\Windows\SysWOW64\rpcrt4.dll; Base address: 0x77820000 File Size: 705520 Version: 10.0.10240.16412 8316 18:27:25:023 Module loaded: C:\Windows\SysWOW64\sspicli.dll; Base address: 0x749E0000 File Size: 116216 Version: 10.0.10240.16384 8316 18:27:25:024 Module loaded: C:\Windows\SysWOW64\cryptbase.dll; Base address: 0x749D0000 File Size: 31528 Version: 10.0.10240.16384 8316 18:27:25:031 Module loaded: C:\Windows\SysWOW64\bcryptprimitives.dll; Base address: 0x74970000 File Size: 365128 Version: 10.0.10240.16384 8316 18:27:25:032 Module loaded: C:\Windows\SysWOW64\sechost.dll; Base address: 0x74FB0000 File Size: 263432 Version: 10.0.10240.16384 8316 18:27:25:033 Thread create ID: 4712; Priority: Normal 4712 18:27:25:034 Thread create ID: 8616; Priority: Normal 8616 18:27:25:034 Module loaded: C:\Windows\SysWOW64\advapi32.dll; Base address: 0x75000000 File Size: 497896 Version: 10.0.10240.16644 8316 18:27:25:035 Module loaded: C:\Windows\SysWOW64\user32.dll; Base address: 0x752E0000 File Size: 1310880 Version: 10.0.10240.16603 8316 18:27:25:038 Module loaded: C:\Windows\SysWOW64\gdi32.dll; Base address: 0x74D70000 File Size: 1365576 Version: 10.0.10240.16644 8316 18:27:25:039 Module loaded: C:\Windows\SysWOW64\imm32.dll; Base address: 0x777F0000 File Size: 168400 Version: 10.0.10240.16384 8316 18:27:25:042 Module loaded: C:\Windows\SysWOW64\msctf.dll; Base address: 0x75420000 File Size: 1180696 Version: 10.0.10240.16683 8316 18:27:25:043 Module loaded: C:\Program Files (x86)\SmartBear\AQtime 8\Bin\Extensions\aqNatProf.dll; Base address: 0x30800000 File Size: 1470416 Version: 8.50.1720.7 8316 18:27:25:045 Module loaded: C:\Windows\SysWOW64\shell32.dll; Base address: 0x756C0000 File Size: 20858360 Version: 10.0.10240.16724 8316 18:27:25:046 Module loaded: C:\Windows\SysWOW64\windows.storage.dll; Base address: 0x76E80000 File Size: 5120056 Version: 10.0.10240.16515 8316 18:27:25:046 Module loaded: C:\Windows\SysWOW64\shlwapi.dll; Base address: 0x77360000 File Size: 274768 Version: 10.0.10240.16384 8316 18:27:25:046 Module loaded: C:\Windows\SysWOW64\kernel.appcore.dll; Base address: 0x74EC0000 File Size: 39792 Version: 10.0.10240.16384 8316 18:27:25:047 Module loaded: C:\Windows\SysWOW64\SHCore.dll; Base address: 0x75090000 File Size: 565656 Version: 10.0.10240.16384 8316 18:27:25:047 Module loaded: C:\Windows\SysWOW64\powrprof.dll; Base address: 0x76D40000 File Size: 269648 Version: 10.0.10240.16384 8316 18:27:25:048 Module loaded: C:\Windows\SysWOW64\profapi.dll; Base address: 0x77780000 File Size: 53728 Version: 10.0.10240.16384 8316 18:27:25:048 Module loaded: C:\Windows\SysWOW64\ole32.dll; Base address: 0x77570000 File Size: 952968 Version: 10.0.10240.16724 8316 18:27:25:049 Module loaded: C:\Windows\SysWOW64\version.dll; Base address: 0x748D0000 File Size: 27360 Version: 10.0.10240.16384 8316 18:27:25:049 Module loaded: C:\Windows\SysWOW64\winsta.dll; Base address: 0x6FFF0000 File Size: 261896 Version: 10.0.10240.16384 8316 18:27:25:052 Module loaded: C:\Windows\SysWOW64\utildll.dll; Base address: 0x5D400000 File Size: 39248 Version: 10.0.10240.16384 8316 18:27:25:053 Module loaded: C:\Windows\SysWOW64\setupapi.dll; Base address: 0x74A00000 File Size: 1733880 Version: 10.0.10240.16384 8316 18:27:25:053 Module loaded: C:\Windows\SysWOW64\cfgmgr32.dll; Base address: 0x773B0000 File Size: 214360 Version: 10.0.10240.16384 8316 18:27:25:054 Module loaded: C:\Windows\SysWOW64\srvcli.dll; Base address: 0x73BD0000 File Size: 73360 Version: 10.0.10240.16724 8316 18:27:25:055 Module loaded: C:\Windows\SysWOW64\browcli.dll; Base address: 0x702F0000 File Size: 43520 Version: 10.0.10240.16724 8316 18:27:25:055 Module loaded: C:\Windows\SysWOW64\samcli.dll; Base address: 0x702D0000 File Size: 65024 Version: 10.0.10240.16384 8316 18:27:25:056 Module loaded: C:\Windows\SysWOW64\netutils.dll; Base address: 0x73BF0000 File Size: 34600 Version: 10.0.10240.16384 8316 18:27:25:056 Module loaded: C:\Windows\SysWOW64\logoncli.dll; Base address: 0x73B80000 File Size: 179256 Version: 10.0.10240.16384 8316 18:27:25:057 Module loaded: C:\Program Files (x86)\SmartBear\AQtime 8\Bin\aqProf.dll; Base address: 0x10000000 File Size: 865232 Version: 8.50.1720.7 8316 18:27:25:061 Module loaded: C:\Windows\SysWOW64\netapi32.dll; Base address: 0x73C30000 File Size: 69232 Version: 10.0.10240.16724 8316 18:27:25:062 Module loaded: C:\Windows\SysWOW64\wkscli.dll; Base address: 0x73C00000 File Size: 55808 Version: 10.0.10240.16724 8316 18:27:25:062 Module loaded: C:\Windows\SysWOW64\bcrypt.dll; Base address: 0x73BB0000 File Size: 106896 Version: 10.0.10240.16384 8316 18:27:25:063 Module loaded: C:\Program Files (x86)\SmartBear\AQtime 8\Bin\aqComm.dll; Base address: 0x30200000 File Size: 254416 Version: 8.50.1720.7 8316 18:27:25:065 Module loaded: C:\Windows\SysWOW64\ws2_32.dll; Base address: 0x776C0000 File Size: 372912 Version: 10.0.10240.16384 8316 18:27:25:066 Module loaded: C:\Windows\SysWOW64\nsi.dll; Base address: 0x75080000 File Size: 20160 Version: 10.0.10240.16384 8316 18:27:25:066 Thread create ID: 9996; Priority: Normal 9996 18:27:25:068 Thread create ID: 4968; Priority: Normal 4968 18:27:25:068 First chance exception 0xC0000005 ACCESS_VIOLATION occurred at 0x00000000, read of address 0x00000000 at 0x00000000 8316 18:27:25:122 Second chance exception 0xC0000005 ACCESS_VIOLATION occurred at 0x656AD9C1, read of address 0x00000000 at 0x656AD9C1 8316 18:27:25:123 Thread exit ID: 9996; Exit code: -1073741819 (0xC0000005) 9996 18:27:26:818 Thread exit ID: 8316; Exit code: -1073741819 (0xC0000005) 8316 18:27:26:819 Thread exit ID: 4712; Exit code: -1073741819 (0xC0000005) 4712 18:27:26:821 Thread exit ID: 8616; Exit code: -1073741819 (0xC0000005) 8616 18:27:26:821 Thread exit ID: 4968; Exit code: -1073741819 (0xC0000005) 4968 18:27:26:821 Process exit ID: 5572; Exit code: -1073741819 (0xC0000005) 18:27:26:822 Debug symbols read for fiberdemo.exe 18:28:50:103 It is proposed that Performance Profiler correclty supports Fiber API.2.3KViews2likes0Comments

