Has anyone gotten the "Agile Task Burndown" dashboard chart to work?
- Bookmark
- Subscribe
- Subscribe to RSS Feed
- Permalink
- Report Inappropriate Content
Has anyone gotten the "Agile Task Burndown" dashboard chart to work?
I have all my testing scope set up as agile tasks. I have them linked to release 8.2 / iteration sprint 4. They all have estimated hours on them. I have my Agile Task Burndown set to release 8.2 / iteration sprint 4. However when I look at my Agile Task Burndown chart it just shows my hours remaining as 0 across the graph. Even when entering hours on a task nothing on the chart changes. What am I missing?
- Bookmark
- Subscribe
- Subscribe to RSS Feed
- Permalink
- Report Inappropriate Content
Hi pgneal3,
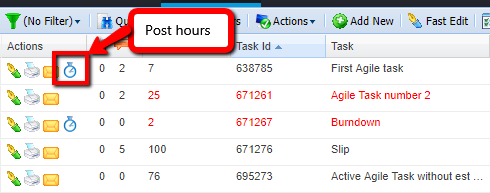
Thank you for your post. You need to post hours for the corresponding Agile Tasks using a special "clock" icon and set the Remaining Hours (or percents of completion). See the attached screenshot. Also, pay attention to the dates. The dashboard shows a period of time from the Actual Start Date for the selected Release till the Actual Finish Date for the Release.
Did my reply answer your question? Give Kudos or Accept it as a Solution to help others. ⬇️⬇️⬇️
