Forum Discussion

3 Replies
- AlexKarasCommunity Hero
Hi,
Not sure if I can be of much help, but...
> I [...] cannot get any result.
Could you clarify what did you mean?
Are the results empty? Or you have difficulties to interpret them? Or something else?
Have you read http://support.smartbear.com/viewarticle/43234/ and http://support.smartbear.com/viewarticle/43573/ help topics?
It is my understanding, that your setup says that you want to profile String and Byte allocations made in the XPO class but I am not sure if this is what you really like to do.
I might be incorrect, but I think that if you want to profile all allocations of System.String within your application, than you need to get the debug info file for this class (from MS site?) and add it to the setup like you did for the XPO class.
 CsabaBuraiNew Contributor
Hi AlexKaras,
We use the XPO as ORM in our system and the application allocate a huge amount of memory during an operation.
I would like to find which object takes the most memory.
It is Impossible to switch on the Entire .Net Core by Classes option and log all the loaded objects because the process memory usage more than 10G. The process never finishes. A lots of small objects are created during the operation.
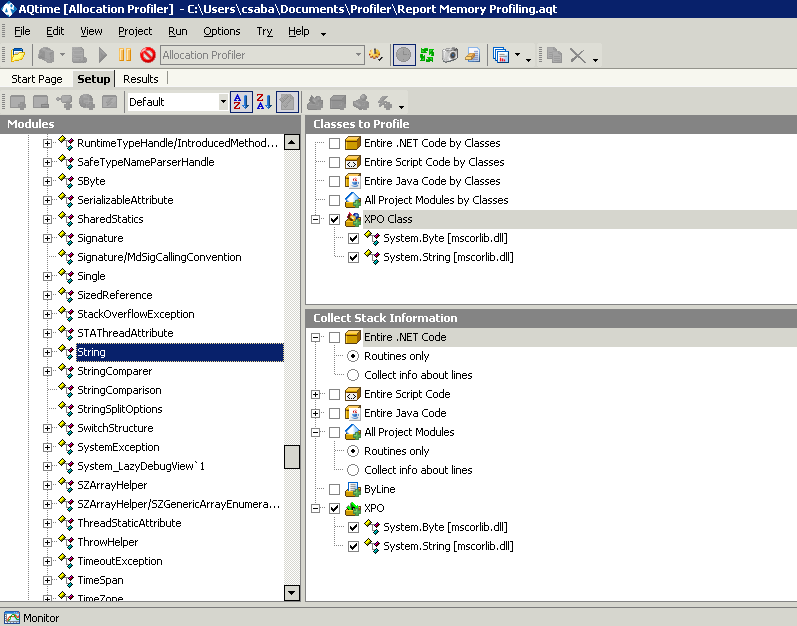
I suppose the string and the byte objects takes the most memory and try to prove it. I have added the mscorlib.dll to the project (that contains the System.String type) and get information only these objects. (Later I can add other classes as well.)
But the result is empty (see picture below). I suppose my project setup is incorrect.
It would be fine to start an overall allocation profiling session where I see all the types in the process on a high level, only the amount of occupied memory by class not the concrete objects. But I cannot find a way to do it in this application.
I have tried execute the test with less objects but with less objects it is impossible to identify the problematic objects.
I would like to limit the examination to concrete objects like System.String.
Thank you for your help.
Regards,
Csaba
CsabaBurai, would you mind opening a Support Case with us, so we can take a closer look at this?
In the meantime, you could try enabling "Entire .NET Code By Classes", disabling "View Project Classes Only" on the Report toolbar, and then filtering by Object Name. This should work.

