MartinB_1
15 years agoOccasional Contributor
Help interpreting Call-Tree + Editor Timings
Hi.
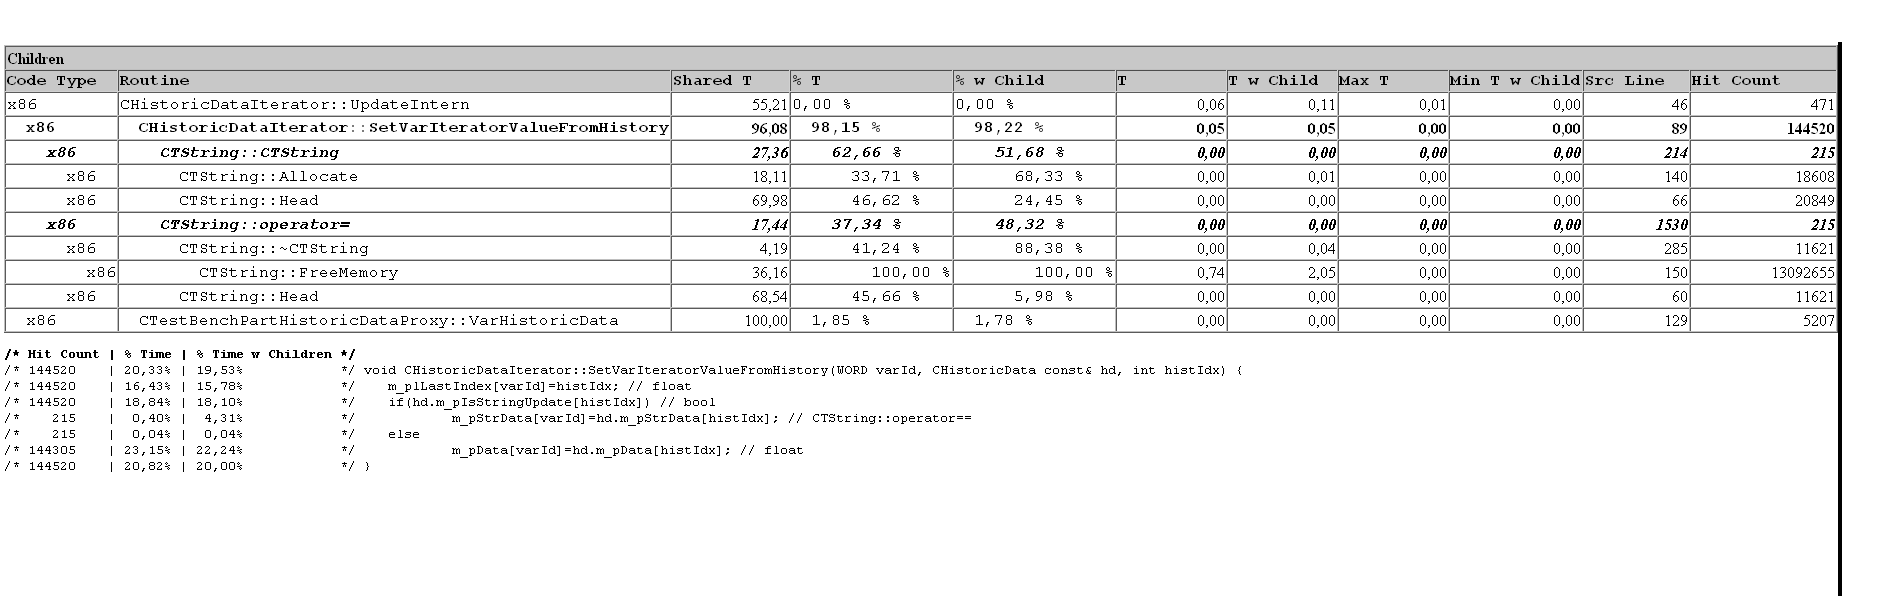
Attached you can find a modified HTML|PNG file that displays information from the Performance Profiler.
The Time columns in the Call Tree do not match up with the Time columns in the line-timings of the Editor.
That is, the Function "SetVarIteratorValueFromHistory" is called 140K times and mainly does some float copies.
215 times of the 140K it will copy a string - the editor panel displays the time taken to be approx 4%, which may be correct.
However, the time values in the Call Tree columns are useless because they just display 0,00 and the Time-% values seem to be relative percentages of all listed child-functions, which is basically useless. Why aren't the %-Time columns percentages of the parent function? Can this be displayed instead?
cheers,
Martin
--------------
| Children | |||||||||||||||||||||||||||||||||||||||||||||||||||||||||||||||||||||||||||||||||||||||||||||||||||
| Code Type | Routine Name | Shared Time | % Time | % with Children | Time | Time with Children | Max Time | Min Time with Children | Source Line | Hit Count | |||||||||||||||||||||||||||||||||||||||||||||||||||||||||||||||||||||||||||||||||||||||||
| x86 | CHistoricDataIterator::UpdateIntern | 55,21 | 0,00 % | 0,00 % | 0,06 | 0,11 | 0,01 | 0,00 | 46 | 471 | |||||||||||||||||||||||||||||||||||||||||||||||||||||||||||||||||||||||||||||||||||||||||
| x86 | CHistoricDataIterator::SetVarIteratorValueFromHistory | 96,08 | 98,15 % | 98,22 % | 0,05 | 0,05 | 0,00 | 0,00 | 89 | 144520 | |||||||||||||||||||||||||||||||||||||||||||||||||||||||||||||||||||||||||||||||||||||||||
| x86 | CTString::CTString | 27,36 | 62,66 % | 51,68 % | 0,00 | 0,00 | 0,00 | 0,00 | 214 | 215 | |||||||||||||||||||||||||||||||||||||||||||||||||||||||||||||||||||||||||||||||||||||||||
| x86 | CTString::Allocate | 18,11 | 33,71 % | 68,33 % | 0,00 | 0,01 | 0,00 | 0,00 | 140 | 18608 | |||||||||||||||||||||||||||||||||||||||||||||||||||||||||||||||||||||||||||||||||||||||||
| x86 | CTString::Head | 69,98 | 46,62 % | 24,45 % | 0,00 | 0,00 | 0,00 | 0,00 | 66 | 20849 | |||||||||||||||||||||||||||||||||||||||||||||||||||||||||||||||||||||||||||||||||||||||||
| x86 | CTString::operator= | 17,44 | 37,34 % | 48,32 % | 0,00 | 0,00 | 0,00 | 0,00 | 1530 | 215 | |||||||||||||||||||||||||||||||||||||||||||||||||||||||||||||||||||||||||||||||||||||||||
| x86 | CTString::~CTString | 4,19 | 41,24 % | 88,38 % | 0,00 | 0,04 | 0,00 | 0,00 | 285 | 11621 | |||||||||||||||||||||||||||||||||||||||||||||||||||||||||||||||||||||||||||||||||||||||||
| x86 | CTString::FreeMemory | 36,16 | 100,00 % | 100,00 % | 0,74 | 2,05 | 0,00 | 0,00 | 150 | 13092655 | |||||||||||||||||||||||||||||||||||||||||||||||||||||||||||||||||||||||||||||||||||||||||
| x86 | CTString::Head | 68,54 | 45,66 % | 5,98 % | 0,00 | 0,00 | 0,00 | 0,00 | 60 | 11621 | |||||||||||||||||||||||||||||||||||||||||||||||||||||||||||||||||||||||||||||||||||||||||
| x86 | CTestBenchPartHistoricDataProxy::VarHistoricData | 100,00 | 1,85 % | 1,78 % | 0,00 | 0,00 | 0,00 | 0,00 | 129 | 5207 | |||||||||||||||||||||||||||||||||||||||||||||||||||||||||||||||||||||||||||||||||||||||||
/* Hit Count | % Time | % Time w Children */
/* 144520    | 20,33% | 19,53%            */ void CHistoricDataIterator::SetVarIteratorValueFromHistory(WORD varId, CHistoricData const& hd, int histIdx) {
/* 144520    | 16,43% | 15,78%            */  m_plLastIndex[varId]=histIdx; // float
/* 144520    | 18,84% | 18,10%            */  if(hd.m_pIsStringUpdate[histIdx]) // bool
/*    215    |  0,40% |  4,31%            */   m_pStrData[varId]=hd.m_pStrData[histIdx]; // CTString::operator==
/*    215    |  0,04% |  0,04%            */  else
/* 144305    | 23,15% | 22,24%            */   m_pData[varId]=hd.m_pData[histIdx]; // float
/* 144520    | 20,82% | 20,00%            */ }
