Can't find the Watch window in the debugger.
I'm trying to debug a script and want to see the values of objects and their properties. I highlight the object and add a watch but there is no window showing the added watch. I'm new to TestComplete; the previous day I was using the watch, it was displayed below the editor. I must have somehow hidden it but can't find how to display it again. Does anyone know how to display it again?
TIA Alan
Claddaghduff ah I see The spy is useful just not in this case.
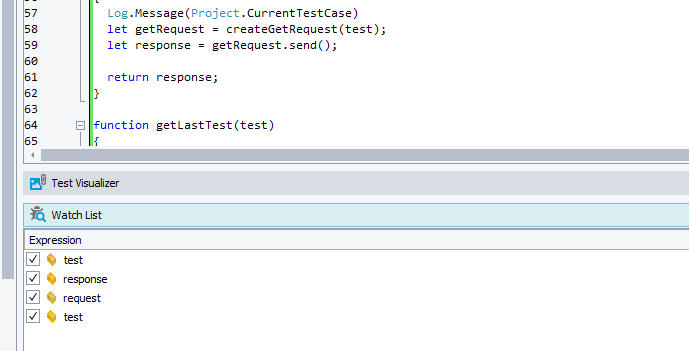
So the watchlist, There are a few ways to get the watch list up
Below should help should it disappear again from your view
https://support.smartbear.com/testcomplete/docs/testing-with/debugging/panels/watch-list/about.html
KR
Vinnie
ps not sure if your a local but Claddaghduff is a lovely spot, il be heading to Omey island this weekend (pending weather and favorable tide times!)